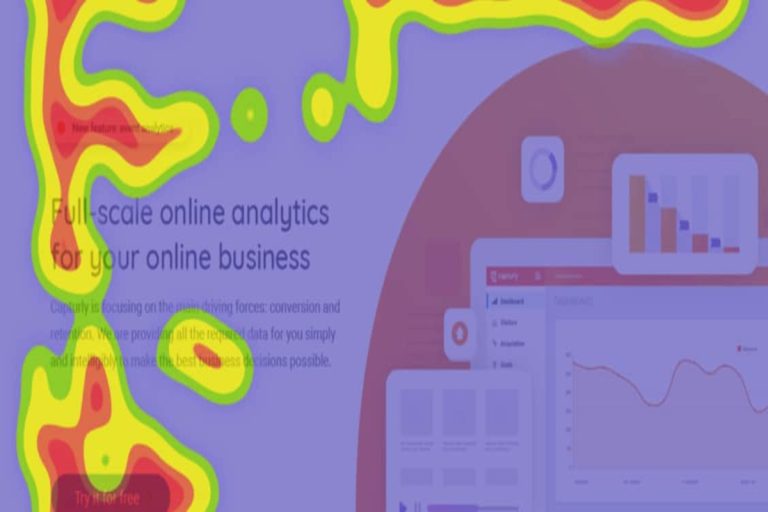
In today’s data-driven world, businesses and individuals alike are constantly seeking ways to gain valuable insights and make informed decisions. One powerful tool that has gained popularity in recent years is the heat map. They provide a visual representation of data, allowing users to quickly identify patterns, trends, and hotspots. In this article, we will explore what heat maps are, specifically focusing on website heat maps, and discuss how to create them using with generators.
What is a Heat Map?
A heat map is a graphical representation of data that uses colors to depict the intensity or density of a particular metric. It provides a visual summary of information, making it easier for users to understand complex data sets at a glance. they are particularly effective when dealing with large amounts of data or when analyzing patterns and trends in a spatial context.
Website Heat Maps:
One of the most common applications of heat maps is in analyzing website user behavior. Website heat maps allow businesses and webmasters to understand how visitors interact with their websites, which areas attract the most attention, and which areas are being ignored. By tracking and visualizing user behavior, website heat maps provide valuable insights that can be used to optimize website design, improve user experience, and increase conversions.
How to Create Heat Maps:
Creating a heat map may sound daunting, but with the right tools and techniques, it can be a straightforward process. Let’s take a look at the steps involved:
- Define your objective: Before creating a heat map, it’s crucial to determine what specific insights you want to gain. Are you interested in analyzing click patterns, scroll behavior, or mouse movement? Clearly defining your objective will help you choose the appropriate type.
- Choose a heat map generator: There are numerous heat map generator tools available online, ranging from simple click trackers to comprehensive analytics platforms. Some popular options include Crazy Egg, Hotjar, and Mouseflow. Research and select a tool that aligns with your requirements and budget.
- Install tracking code: Once you have chosen a heat map generator, you will need to install a tracking code on your website. This code collects and records user data, allowing the heat map generator to generate visual representations of user behavior.
- Configure and customize: After installing the tracking code, you can configure the heat map generator to capture specific user actions or events. For example, you might want to track clicks on specific buttons or form submissions. Additionally, you can customize the appearance of your heat map by choosing colors, opacity, and other visual parameters.
- Analyze the heat map: Once your heat map generator has collected sufficient data, you can analyze the heat map to gain insights. Look for areas with high levels of engagement, such as intense color concentrations, as these indicate strong user interest. Conversely, areas with low activity may suggest opportunities for improvement or optimization.
Heat Map Generators:
As mentioned earlier, there are several generator tools available in the market. Let’s briefly explore a few popular options:
- Crazy Egg: Crazy Egg offers a range of heat map features, including click, scroll, and even confetti heat maps that show clicks based on referral sources. It also provides other useful features like A/B testing and user session recordings.
- Hotjar: Hotjar is a comprehensive user behavior analytics tool that offers heat maps, session recordings, and feedback polls. Its features include click, move, and scroll heat maps, as well as attention heat maps that show how much attention different page elements receive.
- Mouseflow: Mouseflow provides heat map functionality along with session replays, form analytics, and funnel analysis. Its heat map features include click, movement, and attention heat maps, allowing users to understand user engagement and behavior on their websites.
Conclusion:
Heat maps are powerful visual tools that allow businesses and individuals to gain valuable insights from complex data sets. Website heat maps, in particular, offer a deep understanding of user behavior, enabling webmasters to optimize their websites for better user experience and higher conversions. By utilizing heat map generators like Crazy Egg, Hotjar, and Mouseflow, creating and analyzing them becomes more accessible and efficient. So, if you haven’t already explored the benefits of heat maps, it’s time to embrace this valuable tool and unlock new levels of data-driven decision-making.


